Trend-Following ETFs: A Complete Guide
Author: Marco Santanche
What is trend-following
In systematic investments, an attractive yet scientifically controversial strategy is Trend Following (TF). Sometimes the term is confused with momentum (and there can be a fine line between the two), but while the former is commonly used for cross-sectional strategies, the latter is often intended for time-series strategies, although there is no limitation to the way we can implement either of the two.
The case for trend following
We have already briefly discussed TF strategies in our third episode of Quant Evolution. In that case, we were looking for strategies that could protect us from inflation, with the idea that – normally – macro trends last for a while, and TF can benefit from long-term moves in the markets.
While the history of TF dates back to Charles Dow, or some go even further back in the past to David Ricardo, the first one to actually define entries and exits was Jesse Livermore (Footnote 1), who is considered the father of day trading. He is known for looking at the time series and purchasing stocks if they were setting new highs, as well as cutting losses in case there were new lows.
In 2017, AQR published (Footnote 2) a very interesting take on TF strategies. They were looking over the past century to test whether the performance of such strategies was due to statistical evidence or just luck. Their findings suggest that there is strong evidence of trends being a feature of the markets, rather than a randomly occurring event that is not exploitable, and this is valid across all asset classes.
Man Group (Footnote 3) made an in-depth analysis last year regarding the outlook of TF strategies as well. They mention two indices, SG Trend and Barclays BTOP50, that include portfolio managers using trend-following strategies. An interesting finding in this research piece is that short bonds performed well during 2022, when compared with other years, suggesting that the trend can be detected in either direction, but that the traditional assumption “bonds protect when crisis hits” is not always true. And this is a key value provided by trend-following strategies: they can adapt to structural changes in correlations and assumptions, as long as the trend is stable and detectable. Additionally, as per our episode 3, TF is considered an all-weather strategy when it relates to inflation, being able to outperform during long-lasting downtrends.
There is an important relationship between TF and Volatility. It is clear from the definition of volatility that a trend in either direction would mean an increase in volatility: if we define it as the standard deviation of returns (as it is normally assumed), the deviation increases if the move is larger in any direction from the average return. With this definition in mind, a trend is nothing else but a sequence of returns going towards one direction for some time, which means, larger returns in absolute value and biased towards one direction. In this sense, TF is long volatility, because investors would benefit from increases in volatility due to this temporary bias of returns towards one side.
Anticipating trends
Can we anticipate trends? Many have tried in the past to forecast the movement of markets using statistical models, and, more recently, with machine learning. Technical analysis is also an approach to try to identify trends by using indicators, such as Moving Average Convergence/Divergence, Bollinger Bands, and the like. In the Quant space, TA and these indicators are often seen as poor prediction tools, since they provide us with an overview of what happened in the past, without any guarantee of what would happen in the future.
Let us take a cross moving-average strategy on the S&P 500 as an example. It is not so simple to anticipate long-term trends using a single indicator, because we would experience many false signals. We will consider a common setting, the MA 200, and if the price is above this level, we go long, else we go short.
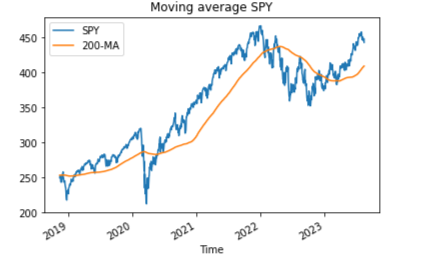
By itself, this is no trend identifier: we are always in one of the two positions, so we are not determining if there is a trend, but just the most convenient position to hold. And this is indeed our performance:
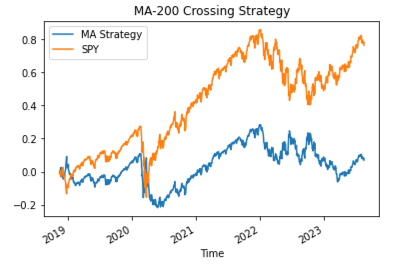
Similarly, the cumulative return plot of a long-only version of the same:
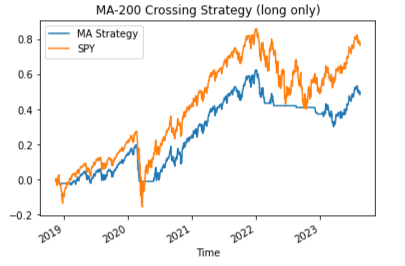
This is just a simple example, and it is understood that nothing of this kind would work over the long term. Nevertheless, it serves the purpose of understanding the fallacy of these indicators: there is no guarantee about what would happen, but just a description of what has happened (“the SPY crossed the 200-MA”). A trend is something more: it must be stable.
This is why predicting using these indicators is not working, or might be working by chance if we select some specific horizon, which would then fall into the mistake category of “data mining” (we test some horizons until we find one that is sufficiently good to outperform the benchmark, if it exists).
However, this is the idea behind TF: markets are hardly predictable, never mind the data we use, or the parameters of our indicators; nevertheless, identifying long-term trends after they started might still be a good strategy, if the trend is solid enough to last for some more time.
A further layer of complexity is building a solid portfolio of multi-asset trend-following strategies, with diversification, overlapping securities and concentration risk. But evidence shows that some funds and strategies have been successful in their specific approaches to these problems.
Retail investors and trends
Rather than trying to build our trend-following strategy (which, to be fair, is relatively simpler than others like statistical arbitrage or portfolio optimization), we will focus on identifying ETFs that provide us with ready-made solutions for TF, and we will try to understand if their behavior is profitable, sustainable and in line with our expectations for the specific feature we are trying to capture.
This is the list of ETFs in scope for the current paper:
The strategies are relatively focused on Equities or Multi-Asset, with some exception on Fixed Income. We will now observe the profile and performance of the ETFs and see how they can contribute to our portfolio. Our analysis will focus on performance over the past year.
Correlations
TF normally seeks to provide investors with positive absolute returns with a combination of both long and short positions. Since there might be no clear trend, some of the analyzed ETFs try to also optimize their cash holdings by Fixed Income securities.
We should expect most of these ETFs to be highly correlated, as trends should be detected by them in similar ways, at least intra asset class. However, the timing and methodologies, including the observed assets, might be significantly different. Please find below the Correlation Matrix for our ETFs:
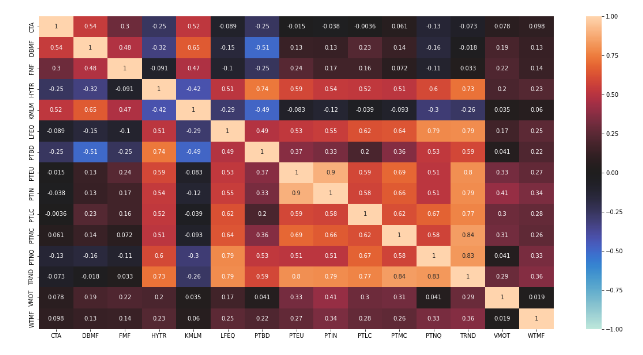
We can clearly see some interesting findings. Most of the strategies are indeed correlated with each other. The highest correlations can be found on the TRND line, which is close to 0.8 or more when compared with all funds but PTBD, VMOT, WTMF, CTA, DBMF and FMF. A surprising negative correlation can be found with KMLM, although both funds are Multi-Asset and relatively risk-seeking (as we will see). The least correlated funds to the others are VMOT and WTMF, but the most negative correlations are the pairs DBMF-PTBD and KMLM-PTBD. Many uncorrelated funds can be found from the darkest-colored cells.
Fixed Income seems to provide diversification from Equities and some of the Multi-Asset funds (which are likely to seek high absolute returns, normally). However, many others on the center of the chart exhibit high correlations with FI as well (PTNQ and TRND, most noticeably). For HYTR, the negative-correlation benefits to Equities are much lower.
All findings are related to the past year only and, as such, they aren't providing us with insights into future performance. Many trends might also be correlated just because there might be positive trends on the Equities side and negative ones on FI (or the other way around), and these ETFs being long-short, they might exhibit similar returns, eventually. But it is interesting to understand how they relate to each other, even if in hindsight.
Past-year performance by asset class
We are going now to see how the strategies behave during different times, depending on their asset class. For simplicity, the classification of Equity/Fixed Income funds is reconducted to Equities, as they use Fixed Income securities just to protect their portfolio from bearish markets, while keeping some yield on their cash.
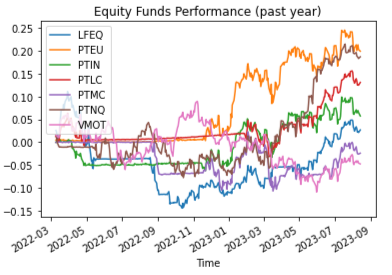
Equity ETFs were in defensive mode from May 2022 until approximately September, with a couple of exceptions (PTNQ, PTMC) which kept their investments active even in those uncertain times for equities. And the resuming of risk appetite is also clearly diversified, with PTMC and LFEQ starting to add riskier assets to their portfolios in September 2022, while PTIN and PTEU clearly came back on Equities in around December 2022. This is likely the reason for such a difference in correlations, and many of the funds profited from the recovery in equities, but got hit in March 2023 (probably due to the SVB bankruptcy), some more dramatically than others (PTMC). However, some ETFs, like VMOT, seem clearly suboptimal when compared with the others.
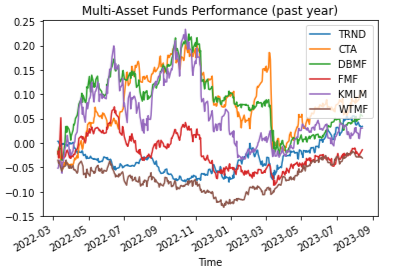
A very different situation is depicted for Multi-Asset funds, which remained invested all the time, likely due to their intrinsically wider opportunity set. SVB also made many of these ETFs suffer, but some much less (WTMF) when compared with CTA or DBMF. Apart from that, the performance seems to be very correlated, with clear exceptions provided by WTMF and FMF, which are, indeed, some of the least correlated funds in the matrix.
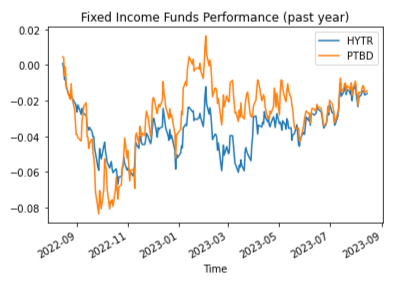
Finally, Fixed Income: the two funds are very correlated, however PTBD seems to be the winner between the two for a long period in 2023, before coming back to being almost completely overlapping with HYTR.
Diversified portfolios
It's interesting now to attempt to build a TF portfolio with a diversified composition based on the past year. We will generally work on two layers:
- Select the best ETF per risk category. While Multi-Asset ETFs can work on a standalone basis, we will look into Equity and Fixed Income combinations, to see if we can outperform the Multi-Asset ones we have in this basket, and BIGPX, the 60-40 benchmark.
- Assign weights. This can be more complicated than it seems, but for our case, we will stick to constant weights (rebalanced monthly) to keep our analysis comparable to BIGPX.
Performance analysis
We will look at the performance of the ETFs up to the period we have analyzed above (Footnote 4) (which means, the last year is our out-of-sample period). As an exercise, rather than looking at standard deviation (volatility), we will select the top 2 for each category based on their Calmar Ratio and returns (Footnote 5).
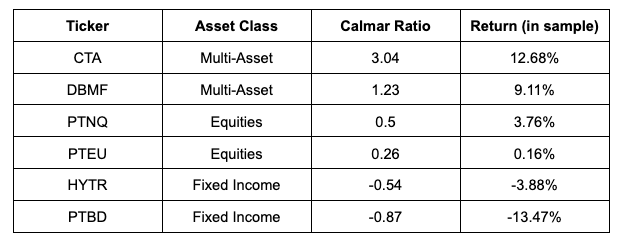
For FI, we have only two funds, so we select both of them. The difference in Calmar Ratio is extreme, in particular between asset classes, but most importantly between the best and worst performers (no other Multi-Asset fund is close to CTA and DBMF in this metric). However, we need to keep in mind that our look-back window is limited to a few months, thus we select multiple funds to reduce our selection bias.
Portfolio composition
Based on these simplistic assumptions, we selected the following portfolios of ETFs based on their metrics and the risk appetite of a theoretical investor. For each asset class, we apply a 50/50 weight to each of the ETFs.
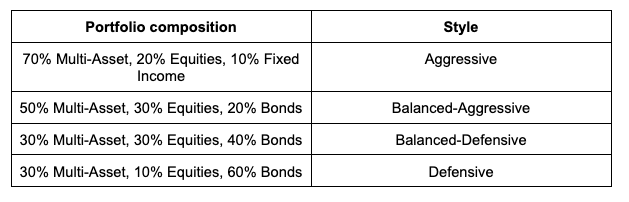
The profile of our portfolios is biased towards Multi-Asset, as they seem to be the best funds on the market. However, we keep a good protection leg for the two defensive portfolios, aiming at protecting against drawdowns for those investors who just want to see their savings growing over time, even if at a very low pace.
Findings
Our four portfolios prove to be similar, yet they clearly set different objectives. These are visualizations of their performance as it relates to BIGPX and the buy-and-hold strategy for DBMF and CTA:
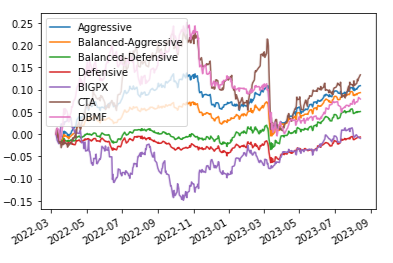
In terms of absolute returns, CTA still outperforms others. Our aggressive strategy is, however, very close, and lower in volatility. DBMF underperforms both the aggressive strategy and the Balanced-Aggressive one, and only our Defensive strategy underperforms BIGPX (the 60/40 benchmark) over the period considered. In terms of drawdowns and the Calmar Ratio:
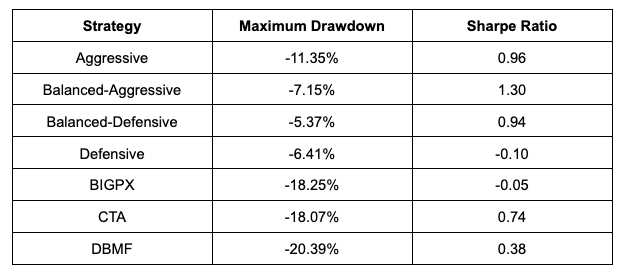
With the exception of the Defensive Strategy, we have outperformed both TF ETFs in terms of both Maximum Drawdown and Calmar Ratio. While the return is better for CTA, its value per unit of risk assumed (the Calmar Ratio, since risk is the maximum drawdown) is much worse than with the Aggressive or Balanced Strategies.
Conclusions
It is true that our analysis is simple; it does not consider transaction costs, and it is not outstanding in terms of results. Yet, we outperform the existing solutions by just creating a combination of strategies that can diversify risk much more effectively than by simply buying and holding ETFs.
TF is an established, centennial strategy that aims at outperforming when trends are strong. Trends happen in different ways across asset classes, and we can leverage the performance and diversification of the products to build a robust portfolio that can stand the test of time.
Update on strategies
We will now add our Aggressive, Balanced-Aggressive and Balanced-Defensive strategies to the shortlist. They proved to be consistent over the backtested period, and they deserve to be followed in our recurring update, since the outperformance in terms of risk management is significant.
Moreover, we will keep an eye on DBMF (already on the list) and CTA, to ensure we continuously compare our strategies with their benchmarks. In addition, those funds have proved themselves to be valuable choices for investors.
Generally speaking, performance deteriorated when compared with six months ago and one year ago, as per last time. Volatility increased, DBMF managed to provide us with some value, but for the rest, we are observing a positive yet decreased performance in the mentioned time window. This is also due to the time window being moving from January 2023 to February (for six months), where we observed an acceleration in performance, and the recent slowdown this month caused by the US Treasuries ratings cut.
Updates as of August 15 2023:
Footnotes
- Jesse Livermore – Extraordinary Stock Trading (jesse-livermore.com)
- A Century of Evidence on Trend-Following Investing (aqr.com)
- Gaining Momentum: Where Next for Trend-Following? | Man Institute | Man Group
- From March 9 to August 14 2022, due to data limitations on some of the funds that have been recently launched.
- The Calmar Ratio corresponds to the ratio between annual return and maximum drawdown (observed over the past 36 months). In our case, we will simply select the best ETFs according to their CR in the observed period, without annualizing.
Trading strategy is based on the author's views and analysis as of the date of first publication. From time to time the author's views may change due to new information or evolving market conditions. Any major updates to the author's views will be published separately in the author's weekly commentary or a new deep dive.
This content is for educational purposes only and is NOT financial advice. Before acting on any information you must consult with your financial advisor.